
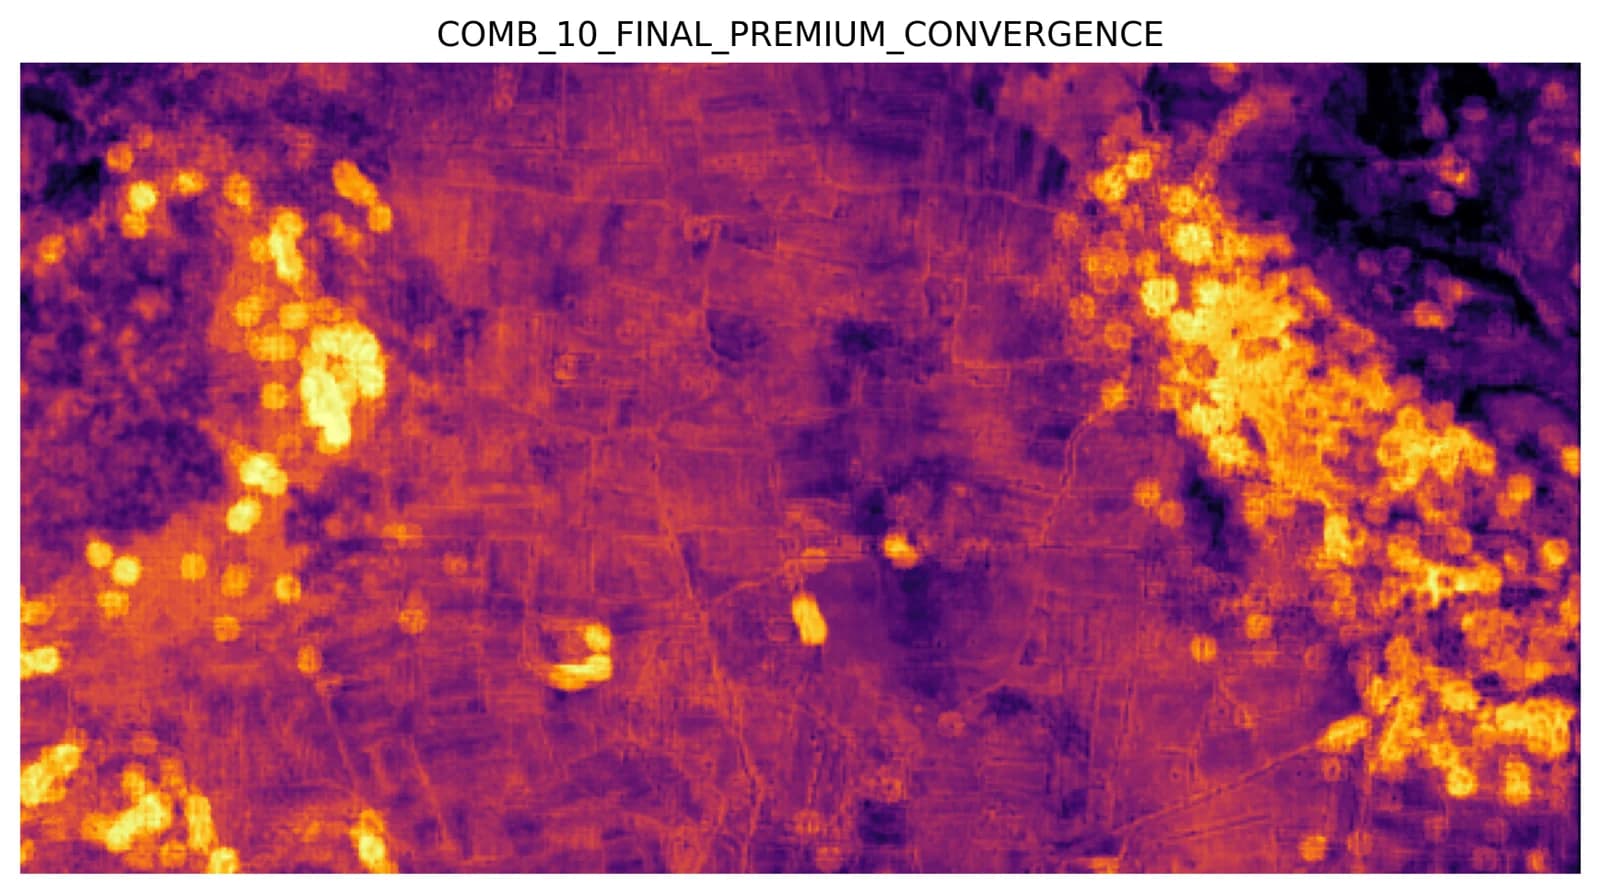
Evidence convergence
Premium convergence raster
Decision: Rapid opportunity triage and early go/no-go review.
Public note: Representative public-safe raster sample; exact scoring logic and project context may be generalised.
From rapid screening maps to full technical reports, Xidar packages satellite evidence, structural interpretation, prospectivity ranking, target logic, GIS outputs, dashboards, and field-validation planning into decision-ready exploration deliverables.
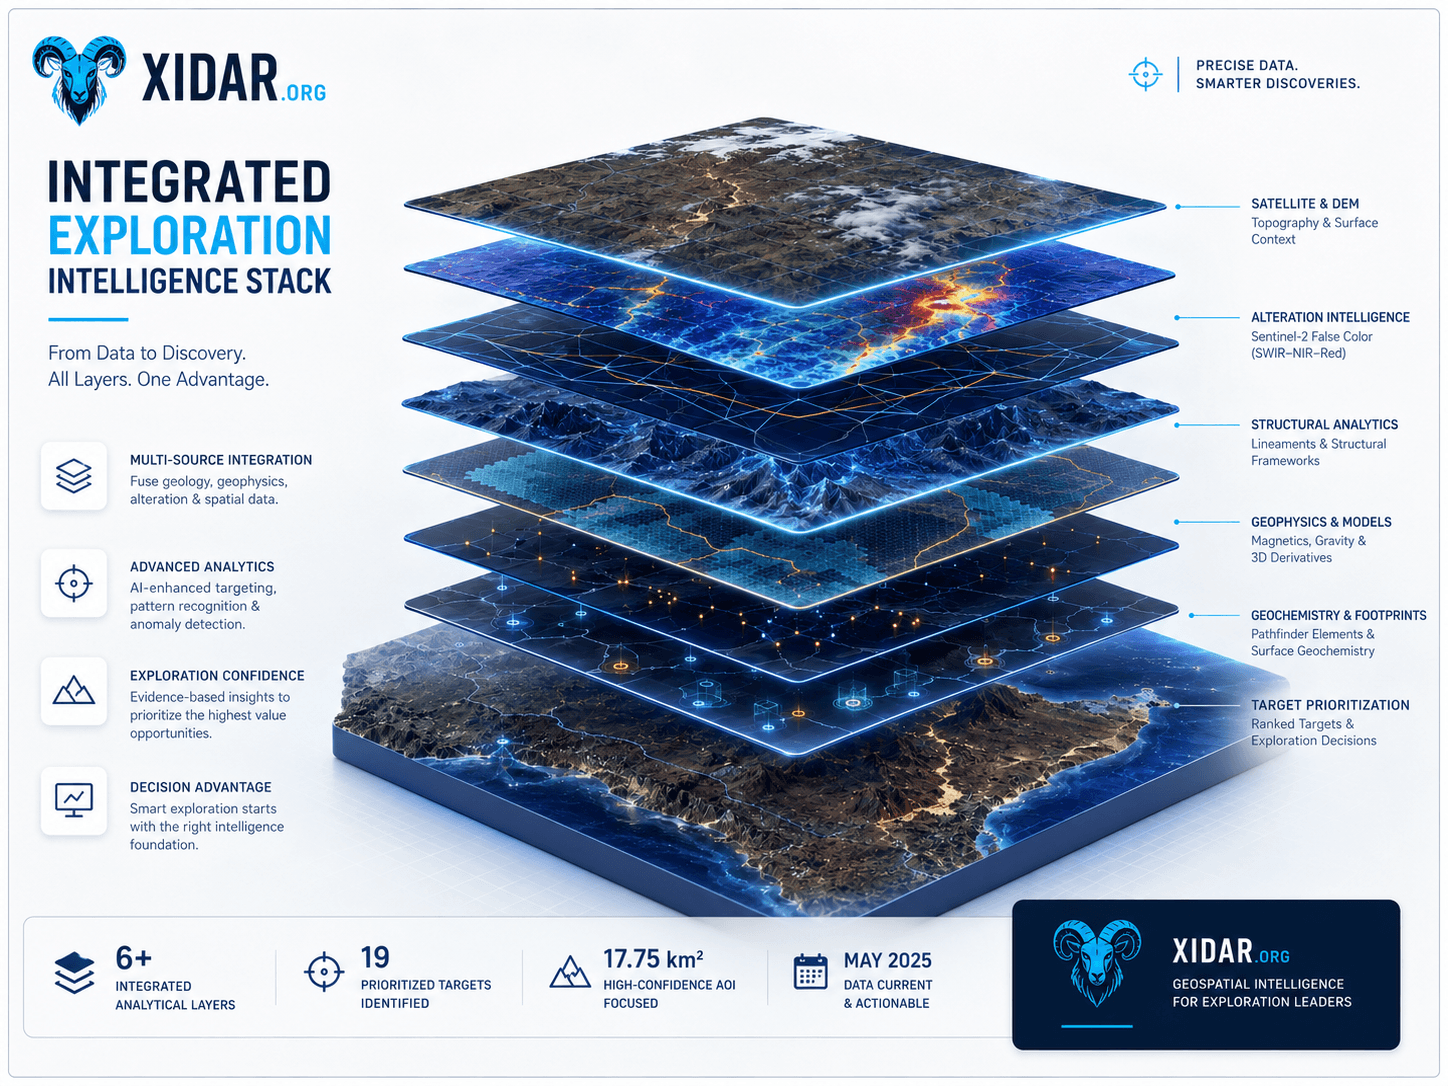
Select a tier to see how the visible deliverables, decision value, sample visuals, and output depth change across the Xidar package ladder.
A quick public-safe view of whether an AOI deserves deeper technical work, using convergence rasters, basemap review, and first-pass opportunity logic.
Should this area move into deeper mapping?

WebP previews render quickly on the page. Full-resolution originals remain available through the preview action where useful.
Decision: Rapid opportunity triage and early go/no-go review.
Public note: Representative public-safe raster sample; exact scoring logic and project context may be generalised.
Decision: Check imagery quality, visual context, and usable map frames.
Public note: Some basemap sheets may expose place names or project codes and require review before public release.
Decision: Compare alteration proxy expression against terrain and structural context.
Public note: RGB composites are interpretive aids and require geological review and field validation.
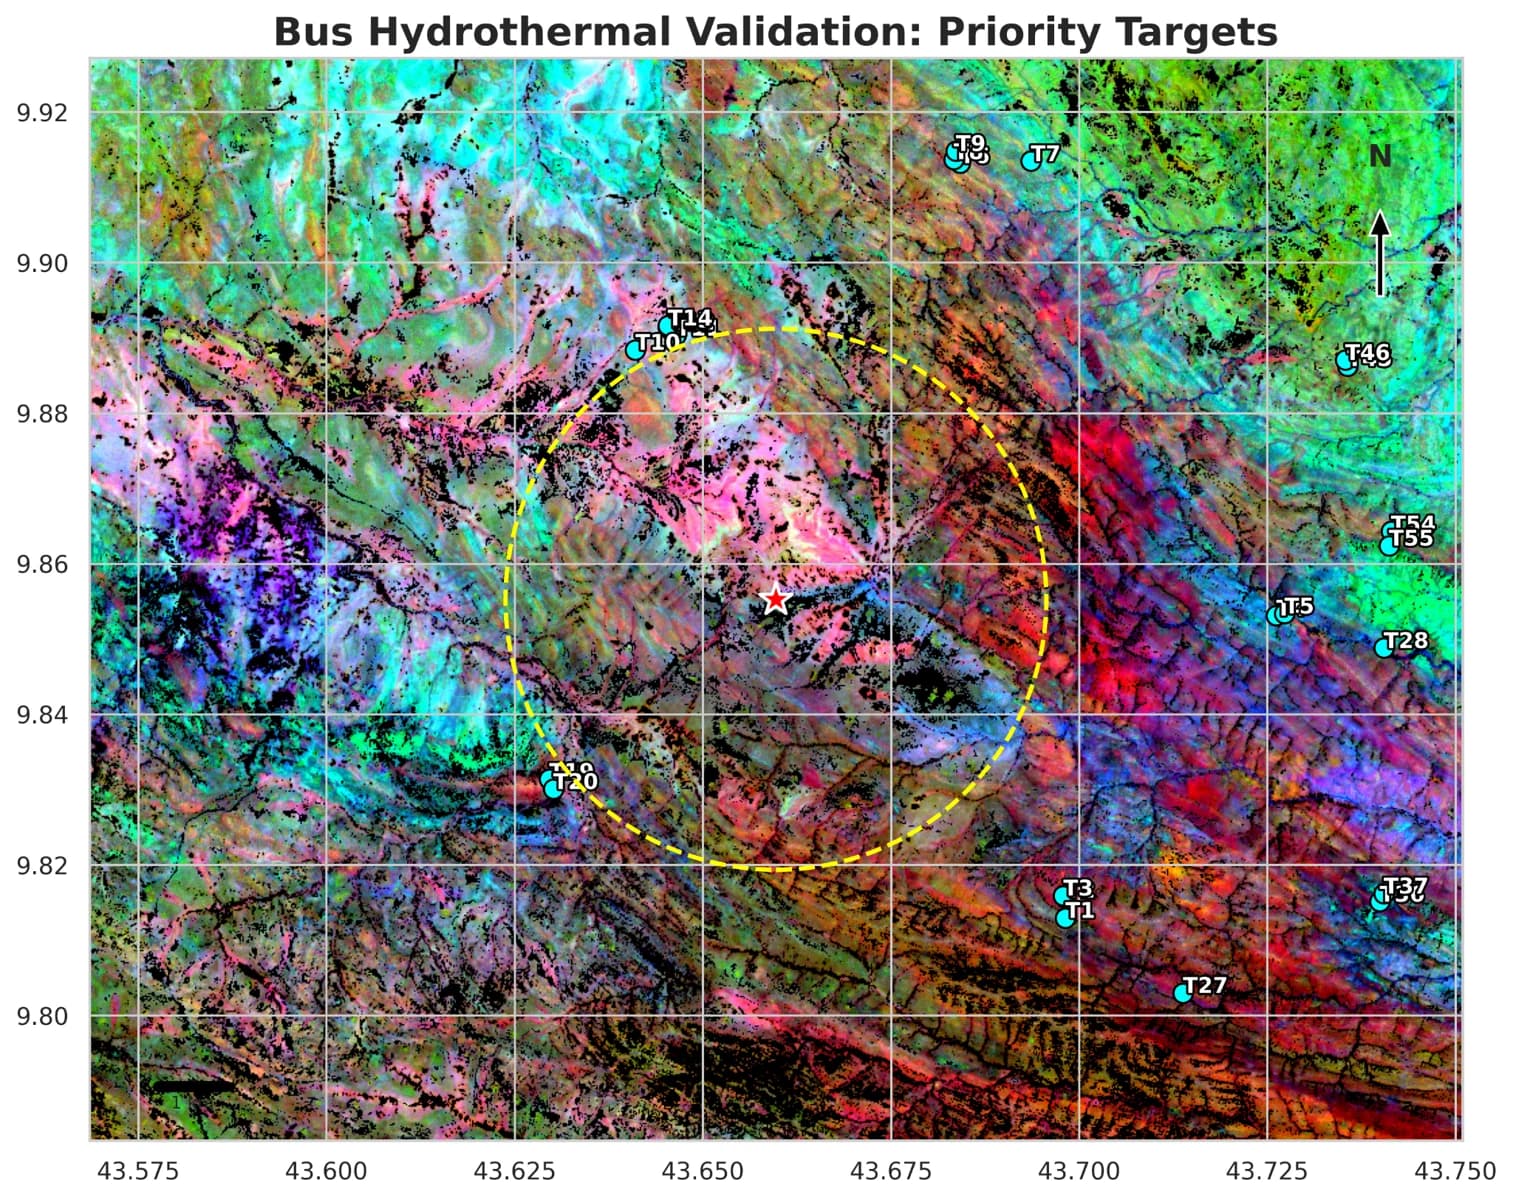
Decision: Prioritize field checks and compare candidate target areas.
Public note: Target IDs and approximate locations may need masking or generalisation for public samples.
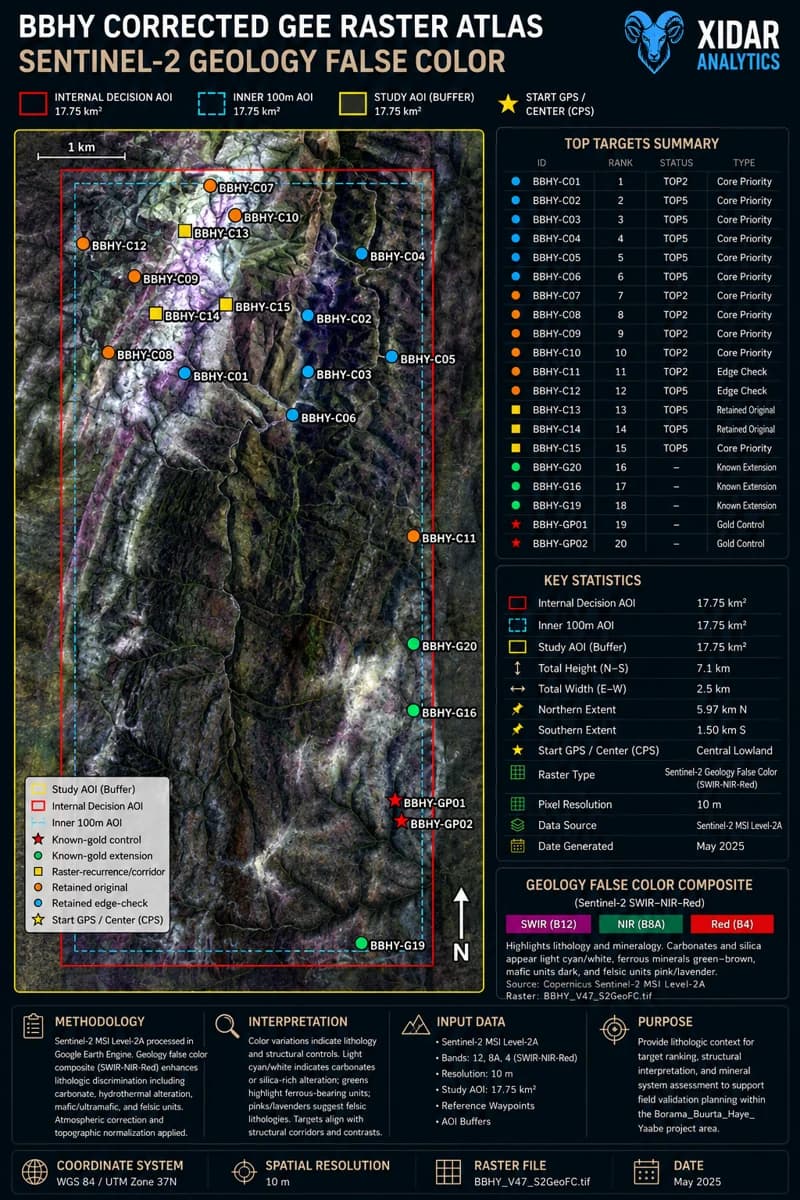
Decision: Support lithologic and structural interpretation through atlas-style plates.
Public note: Public atlas derivatives should be reviewed for project codes, labels, and target identifiers.
Decision: Connect structural corridors with alteration evidence for ranking discussion.
Public note: Composite outputs should be treated as screening evidence until validated in the field.
The page shows preview cards first. Interactive dashboards, embedded maps, and HTML reports are intentionally lazy-loaded.
Executive review of target clusters, layers, and decision support context.
Layer switching, target context, and map-led technical discussion.
Review how a technical summary can pair report text with visual evidence.
Analysis-ready evidence surface
Geological or structural reading
Why a zone advances
Comparable target logic
Presentation-ready map frame
Decision narrative and caveats
Next validation step
Strategist and Enterprise reports can combine map plates, methodology, target logic, confidence interpretation, and phased field-validation planning.
Clarifies project purpose, delivery boundaries, decision context, and executive takeaways.
Clarifies project purpose, delivery boundaries, decision context, and executive takeaways.
Some outputs may be adapted from previous delivery formats and can contain sensitive geospatial or commercial context.
Exact locations, coordinates, licence boundaries, client identifiers, and sensitive target information may be removed or generalised.